How to map information flows in distorted environments
Information source mapping is the process of methodically identifying, documenting, and categorizing all the potential sources of information for a specific topic or audience segment.
This is about creating a structured understanding of sources, including everything from official government websites to informal social media groups and private community channels.
The purpose of doing this is to identify which sources house the specific information you seek and where information gaps exist, and to figure out ways to actually collect the information you need from a more targeted range of sources and information formats.
In other words, an information source map makes for a more efficient, sustainable and systematic process of data gathering through methods discussed in more detail in our post on hybrid data gathering.
It will also show where your own reporting will fill gaps and fulfill needs identified through your audience research, in relation to other sources.
Jump: HOW to build your information map | WHAT we learned
In places where direct reporting is difficult due to censorship, security concerns or techno-autocratic control, source mapping is one way to overcome (or at least mitigate) those barriers. Our methodology is specifically tailored for these contexts, focusing on digital and proxy sources that can be accessed remotely, but it is just as valid in any less distorted contexts.
As you map the information environment, experience how information flows on different platforms, and plan your data gathering, you will create a comprehensive, living database of sources that can be continuously updated and expanded based on changing needs.
This database becomes the backbone of your reporting and product ideation, enabling you to deliver actionable intelligence that addresses your intended audience’s information needs.
How to build an information source map
You can scale this process up for large newsrooms or pare it down to focus on a niche issue, as Gazzetta has done in one of our projects on gathering wage information for a specific job type across districts in a major city.
To get started with data reporting, organizations need at minimum 1-2 team members with the capabilities to:
- Map information sources in the relevant location, using a simple spreadsheet, to log information sources and their utility to your reporting;
- Identify data gathering and analyzing tools, especially those specific to identified information sources, to plan for harvesting the data you need from different sources;
- Spend time on information platforms as a user, and have fluency in the relevant language, including understanding current slang or internet language.
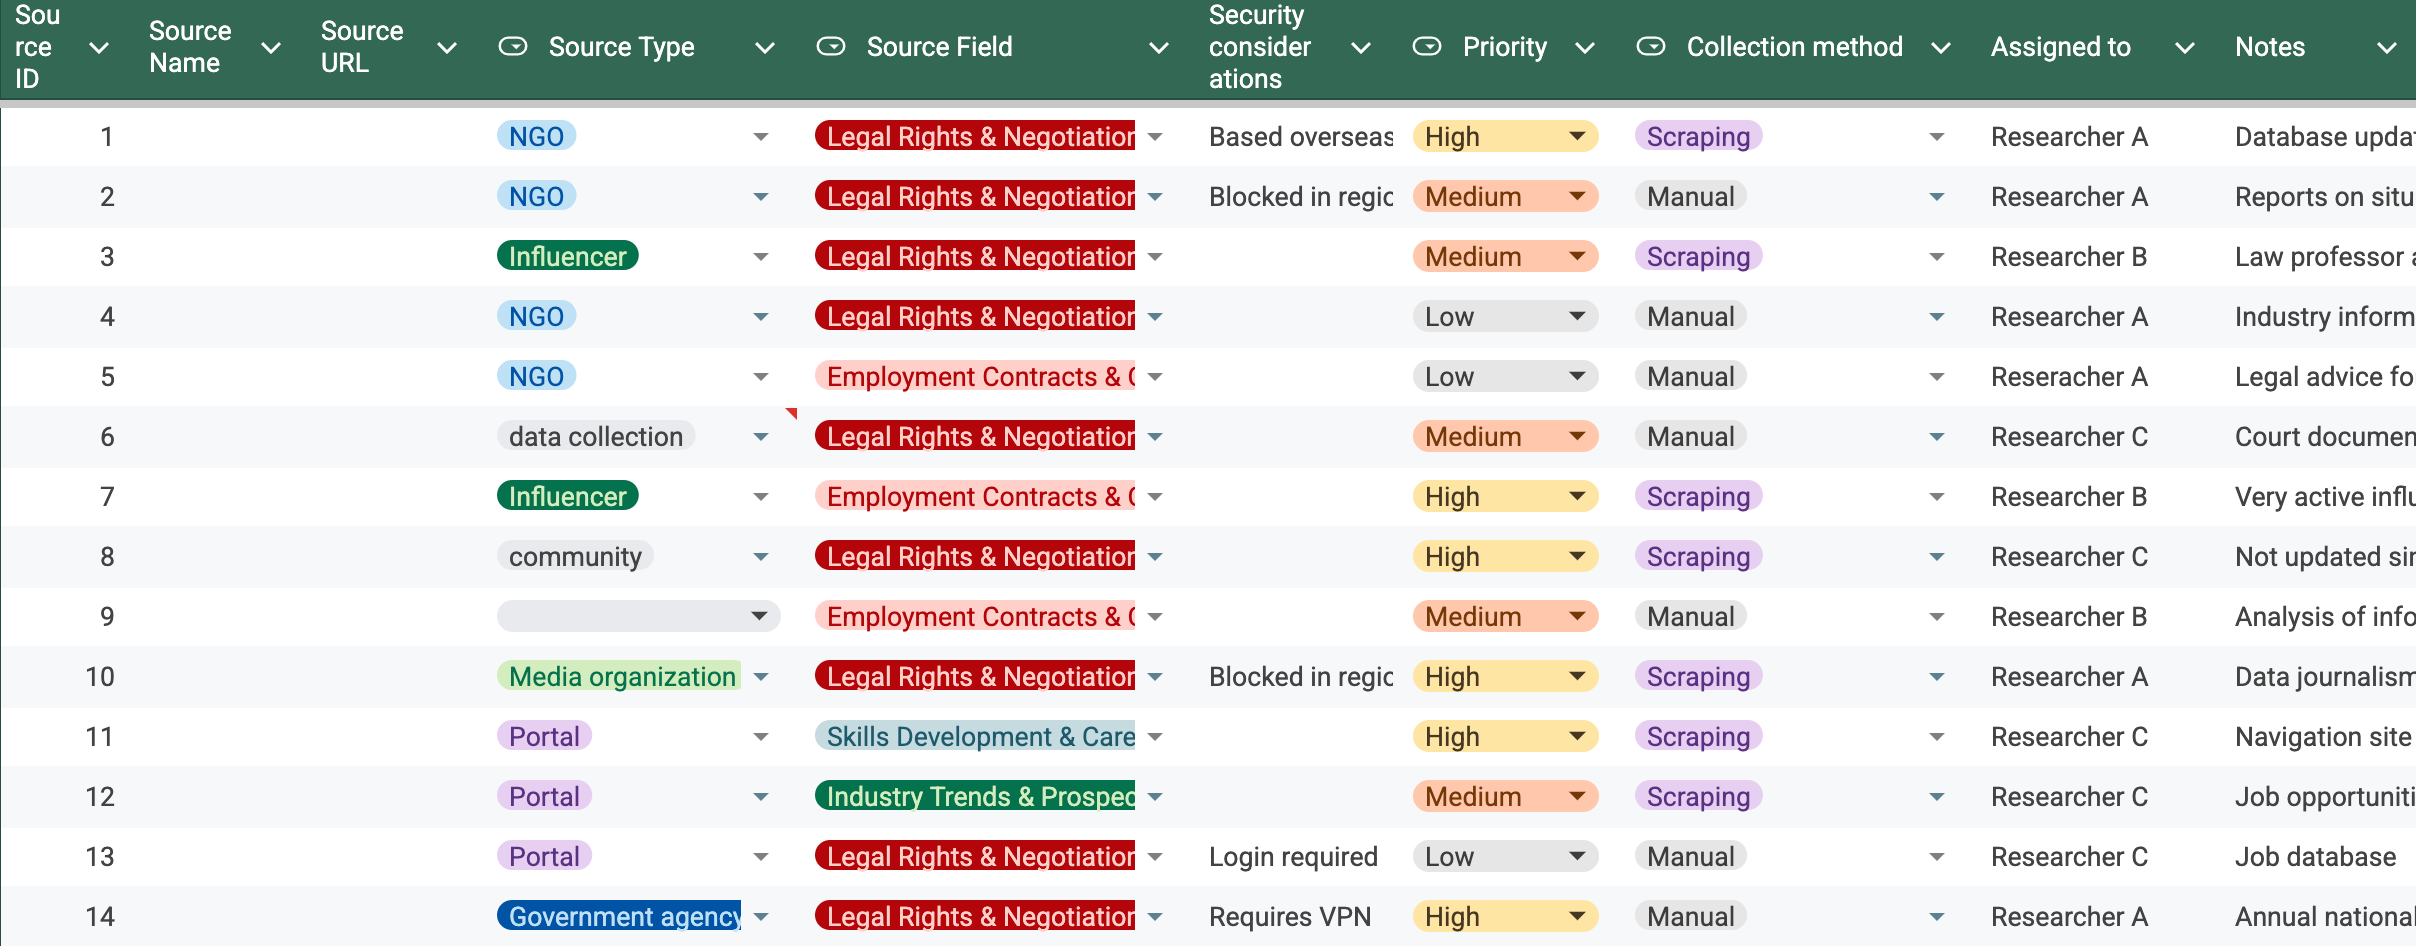
In your database, keep track of the name of the source, where you can find it online (or offline), the type of source such as government website or social media platform, the type or topic of information found there, any security considerations in accessing it, and any relevant notes about it.
- Communications: Even in the early stages of gathering background data, avoid using unencrypted platforms for discussions, as they may be surveilled (even after the fact).
- Storage: All collected data, notes, and documents should be stored securely, and deleted when no longer needed. This means using encrypted hard drives or cloud services with strong, end-to-end encryption, secure log-ins and when possible expiring file storage.
- Anonymity: Whenever possible, use VPNs or Tor when researching sensitive topics to mask your location and identity.
As you catalogue these sources for future reference, also note whether each source would be a good candidate for manual data collection, data scraping, or both/neither, and assign the task of researching which tools can be used to collect that data.
Remember that this is not the time to conduct the data gathering, but to create a comprehensive database of where information lives, how valuable or rich the data housed there is, and how easy or difficult it will be to access and harvest it. You will also find where gaps exist, leading you to seek out those sources or create them yourself as part of your reporting.
Step 1: Start with existing knowledge
Don't start from scratch. Begin by leveraging your existing knowledge from the Audience Research phase. Those early discoveries, whether from interviews, surveys, or literature reviews, are the foundation of your source database.
In one of our projects at Gazzetta, our audience research process identified that people want more information about jobs so that they can earn higher incomes and have better opportunities. This led us to broadly map wage information across blue-collar industries, which we later narrowed to information on a specific job type.
Based on findings from our audience research, we included in our information map a broad range of sources from established social media and messaging apps to newer platforms and traditional media. This is in addition to sources such as NGO reports and databases, official government websites, and job platforms.
We included sources our intended audience uses because our audience segmentation uncovered different habits and use patterns, such as the prevalence of sharing on short video platforms among some segments, and the popularity of information sharing on group chats.
These channels are valuable sources of audience-generated data that we didn’t want to miss by only focusing on official sources.
Step 2: Conduct platform-based discovery
After using your findings from audience research, input into your information map all the major sources of news and information in the relevant operating environment.
Conduct a systematic sweep of these major distribution platforms, like government websites, news sites, the most popular social media sites, and discussion fora.
Try searching for keywords to get a sense of the types of information contained in each platform and its relevance or utility to your reporting. In your information map, log what kinds of relevant information each contains.
As you create your information map and explore the contents of different information platforms, your team should be asking questions such as:
- What information is available on this platform?
- Is the information up-to-date, static, dynamic, etc.?
- What form or format is that information in?
- How does it compare or relate to information in other sources?
- What is the priority level of the data in this particular source?
- Given the information in this source, what gaps still exist in our information map?
For example, in our project seeking information about a specific job type, we noted that some national data was available on economic trends in recent years in an industry broader than our single job type, whereas job boards contained up-to-date salary ranges, locations, and benefits for the job we were targeting in our research.
While we would not need to access the national data beyond a single download, we would need to find a way to continuously harvest the data on our target jobs in the job boards, since they are updated with new data constantly.
The gaps we identified included the veracity of salary descriptions in job postings, the role of hiring agencies as middlemen, the average wages for the districts in which the jobs were located, and expected housing and transportation costs.
Before we collected the data, we documented in our information map this kind of broad information for going back later—or flagging a source that was not worth spending more time with because it was a low priority or duplicative information.
For social media platforms, this step goes beyond a simple search to see what results are returned on the platform. It involves creating accounts on key platforms to understand their recommendation algorithms and how they surface relevant content.
After signing up for social media platforms identified as likely containing the types of information you seek, it’s not enough to follow Key Opinion Leaders (KOLs) and other creators that algorithms may push you toward.
This is because their discussions may follow mainstream public debate and represent the biggest voices. However, this is likely not the type of information that will be useful or relevant.
Rather, you’re looking for the best information sources on the platform for the specific research question you’re trying to answer. Account reach and subscription count may be good indicators, especially where these accounts aren’t favoured by algorithms. But the data may also be found by keyword searching, when there is no one dominant account posting about your selected topic.
Questions to ask:
- What information on your topic are people organically sharing, and with whom?
- Do they use hashtags or keywords?
- Do they react to events without giving context, meaning it’s more difficult to discover their posts?
- Do they use slang or jargon?
- Do they share information in private channels that aren’t distorted by algorithms, such as Telegram and Facebook groups?
Which sources are most promising for data gathering in later stages? Flag those carefully and prioritize them.
Which sources have less relevant information than imagined? Logging those and keeping them in the database will avoid duplication of efforts in the future, especially if personnel change.
Step 3: Filling the gaps
The final phase involves a critical analysis of your source collection to identify and address any blind spots. Look for underrepresented regions, industries, or types of information.
In our audience research, we found that older members and more conservative members of our intended audience showed increased trust in private information channels and offline sources.
Because our information map cannot systematically capture that type of information, we used the snowballing method to understand and glean what we could—including becoming aware of information gaps—rather than ignoring these channels out of convenience.
Snowballing is a sourcing technique that involves methodically following the trail of information from one source to the next.
You start with a few known, trusted sources and track how information flows to and from them.
This can mean following links, tracking organizational connections, and noting how information is shared through different channels.
It's an organic process that helps you uncover both formal and informal information channels that might not appear in a standard keyword search.
This method is especially useful for sensitive or emerging topics, as it can reveal how information spreads through indirect or obscured channels.
Actively seek out alternative information channels that might have been overlooked, ensuring your source mapping is comprehensive and balanced.
The result is a living database of information sources that can be continuously updated as new sources emerge, existing ones change, or the focus of the information you seek evolves.
What we learned
The information source mapping process is the background work needed to build a sustainable and scalable system for remote data gathering.
This process will give you a clear roadmap for where and how to gather reliable information: what data is available (and unavailable), where it is located, what format it is in, and how difficult or easy it will be to access through hybrid data collection methods.
After using this information map to gather the data, clean it, and verify it, you will be on your way to your reporting concept and eventually creating news products.
We started with the audience need for information about better jobs. Our information map showed us what was available and what was not, and that we should focus our efforts on the information contained in job boards.
After we scraped job board data, we found that one specific job type was ideal for our reporting, and we tested a hypothesis that education levels were immaterial to wage levels in this industry, and that balancing cost of living with wages meant that a lower-paying job might make more financial sense for some audience members.
This became our reporting concept that we carried into our product ideation phase.
When creating our information map, we found that official data sources—both nationally and regionally available—lag by over one year and are not disaggregated enough to be useful for our purposes beyond making industry or average comparisons.
Regional and district-level data is not systematically collected or published by government sources, and job-specific information is up-to-date and most readily available in job boards.
However, personal anecdotes about actual wages and benefits compared to job ads can be found on social media platforms.
From this overview, we learned that, despite the advances in artificial intelligence, there continues to be enormous opportunity for journalists to deliver informational value to people:
- Sources are complex and fragmented: The data we sought for our reporting was scattered across a wide range of official and unofficial platforms, including social media, fora, and legacy media. Snippets were selectively available on different platforms and in various formats, so mapping those locations first helped us gather them systematically in the future steps.
- Offline channels still matter: Older members and more conservative members of our intended audience still heavily rely on offline methods like peer referrals and informal channels. This highlights a key information gap that digital-only solutions can't fill. It’s also an advantage that we as humans have over large models, although it takes more time and planning to gather it.
- Data quality varies: We found persistent issues like factual misrepresentation and outdated information—as well as data available in disparate units or formats—which all requires a rigorous data cleaning and verification process.
At Gazzetta, we continuously revert to and update our information map to develop specific data collection strategies, focusing on the most promising platforms for different uses, while being mindful of the limitations we've identified. What we learned is also useful when thinking about dissemination in later stages.
Our work to fill the information gaps for for our intended audience is driven by our commitment to service-oriented journalism and addressing information inequality. By building this system, we're creating a durable resource that can be leveraged again and again in the future.
Putting this all together in later steps requires a clear plan, some tools, and consistent data gathering such as on a weekly basis. Read more about hybrid data collection methodology and our step-by-step process.
Join us on our process in the Audience Research, Reporting, and other phases. If you haven’t already, sign up to our newsletter so you don’t miss out. In it, we write about the challenges we face and welcome your help in figuring things out!
If you have feedback or questions, don’t hesitate to get in touch at hello@gazzetta.xyz.